
Documentation/Analytics
Campaign Reports
Compare campaigns and spot trends over time.
Analytics → Campaign Reports covers performance across all your email campaigns, rather than one at a time.
Period selector
Choose the reporting window at the top — for example Last 30 days. Everything on the page updates to match.
The KPI cards
Eight cards summarise the period: Campaigns, Emails Sent, Delivered, Opened, Clicked, Bounced, Skipped, and Unsubscribed. Each card names the base its percentage is calculated against — *% of sent*, *% of reached*, *% of delivered* — because they aren't all the same. See the metrics glossary.
Click any card except Campaigns to open a drawer listing the individual contacts behind that number.
Performance over time
Performance Over Time charts your key metrics across the selected period, so you can see trends and the effect of individual sends.
Campaign snapshot
A table comparing campaigns side by side:
| Column | Description |
|---|---|
| Campaign Name | Campaign name |
| Audience Size | How many people it went to |
| Open Rate | Share who opened, of delivered |
| Click Rate | Share who clicked, of delivered |
| Status | Sent, sending, scheduled |
| Sent Date | When it went out |
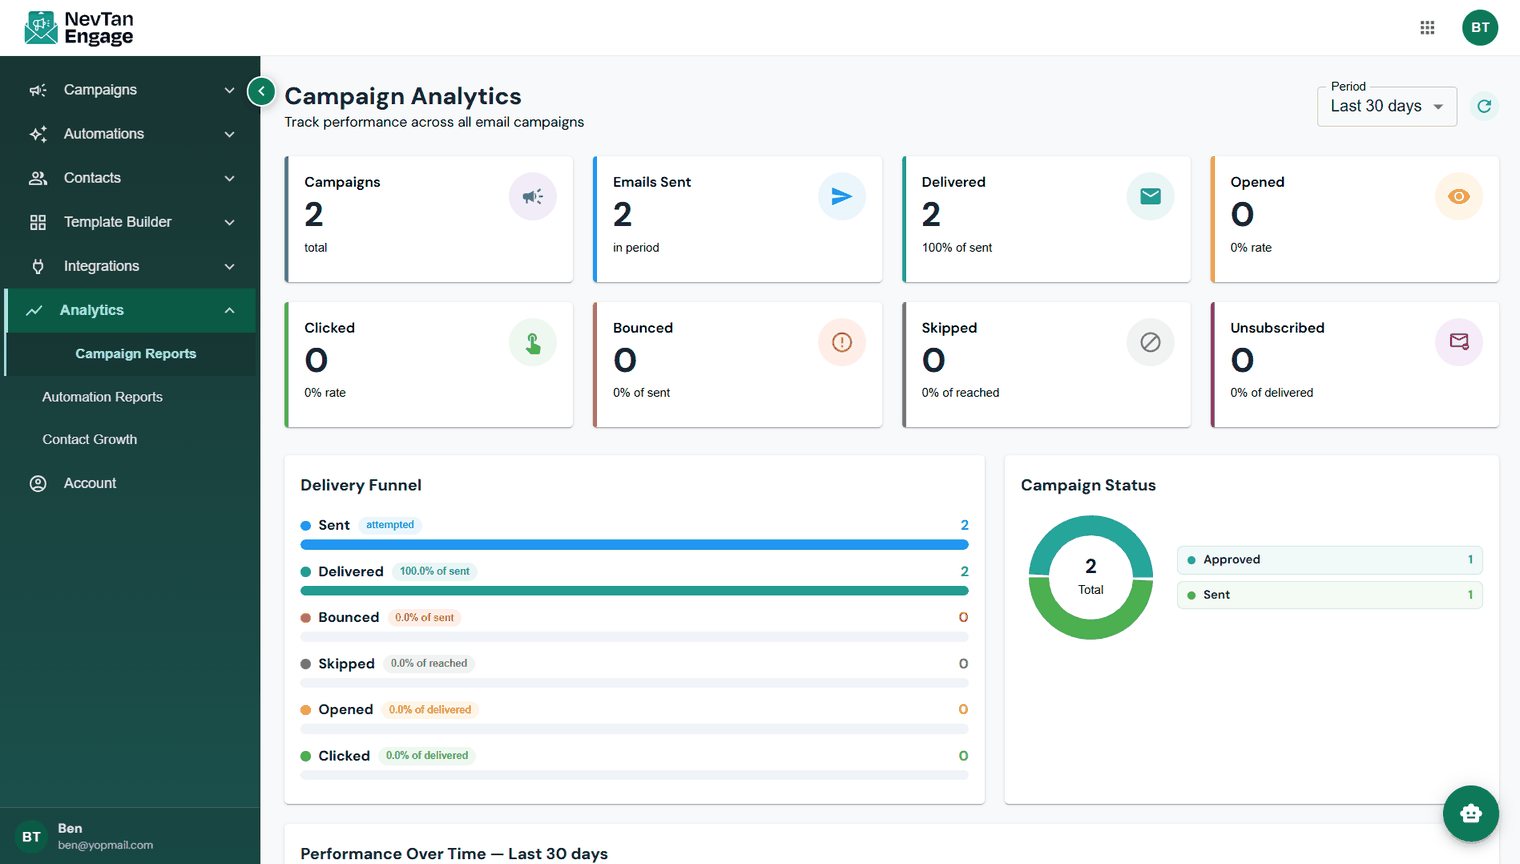
Campaign Reports
Use Campaigns to Display to control how many rows appear — the last 5, 10, and so on.
For one campaign in depth, including its per-recipient activity, open the campaign itself — see Reading a campaign's results.
Campaign analytics requires a Starter plan or above.