
Documentation/Analytics
Automation Reports
See exactly which step of an automation people drop out at.
Analytics → Automation Reports covers performance across all your built-in and custom flows.
Summary metrics
| Metric | Meaning |
|---|---|
| Total Flows | All flows, split into live and draft |
| Live Flows | Currently running and enrolling contacts |
| Total Triggered | Contacts who entered flows in the period |
| Completed | How many finished, plus your completion rate |
| In Progress | Contacts currently mid-flow |
| Failed | Contacts whose flow run failed |
| Avg Open / Click Rate | Across all email steps in all flows |
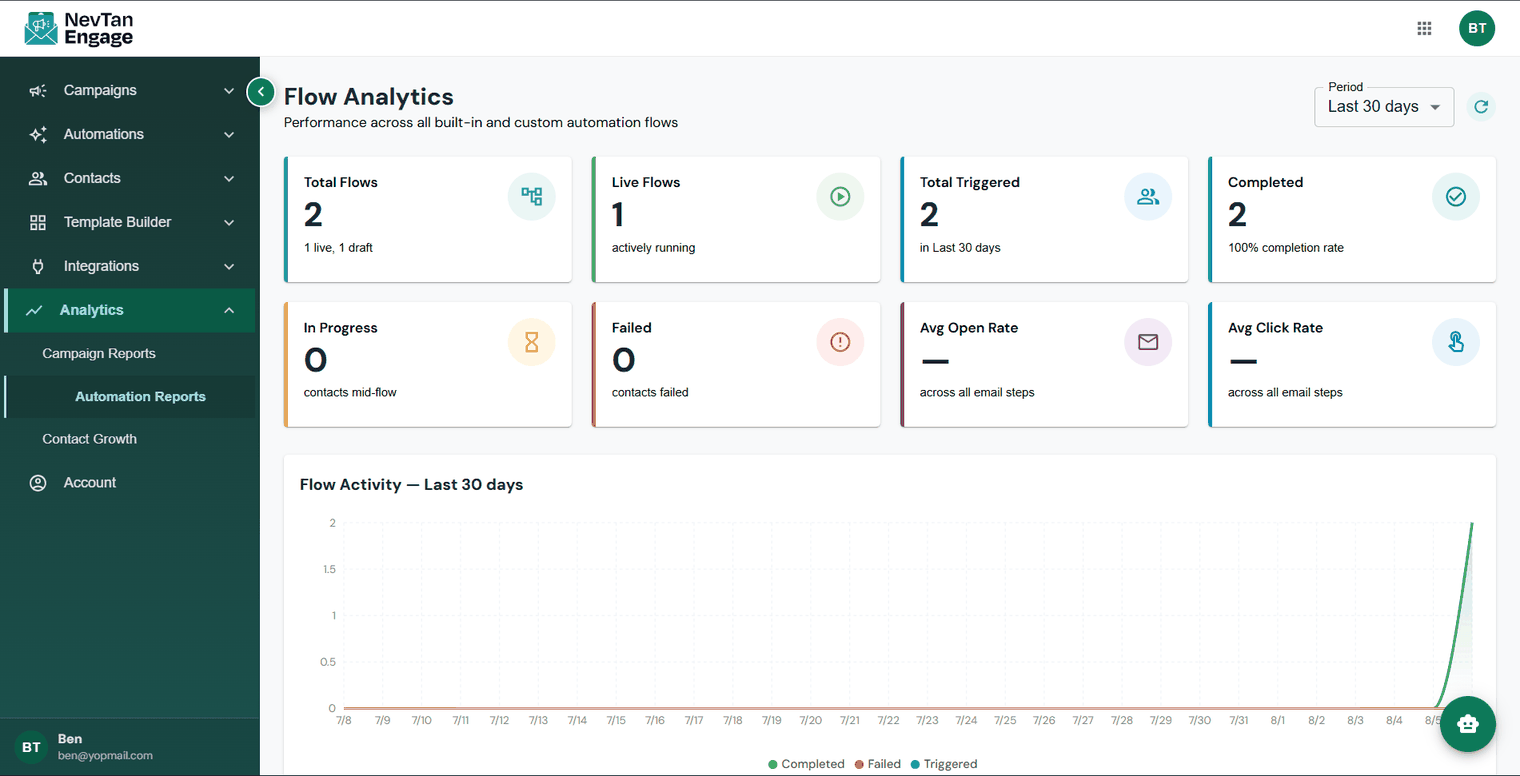
Automation Reports
The all-flows table
Every flow with its Status, Steps, Triggered, Completed, In Progress, Failed, Completion %, Avg Emails, Open Rate, and Click Rate.
The step funnel
Click any row to see the step-by-step funnel. This is the most valuable view in the whole product: it shows exactly which step people drop off at. If 80% of contacts never get past step 2, that's the email to rewrite — and you'd never have known from the averages.
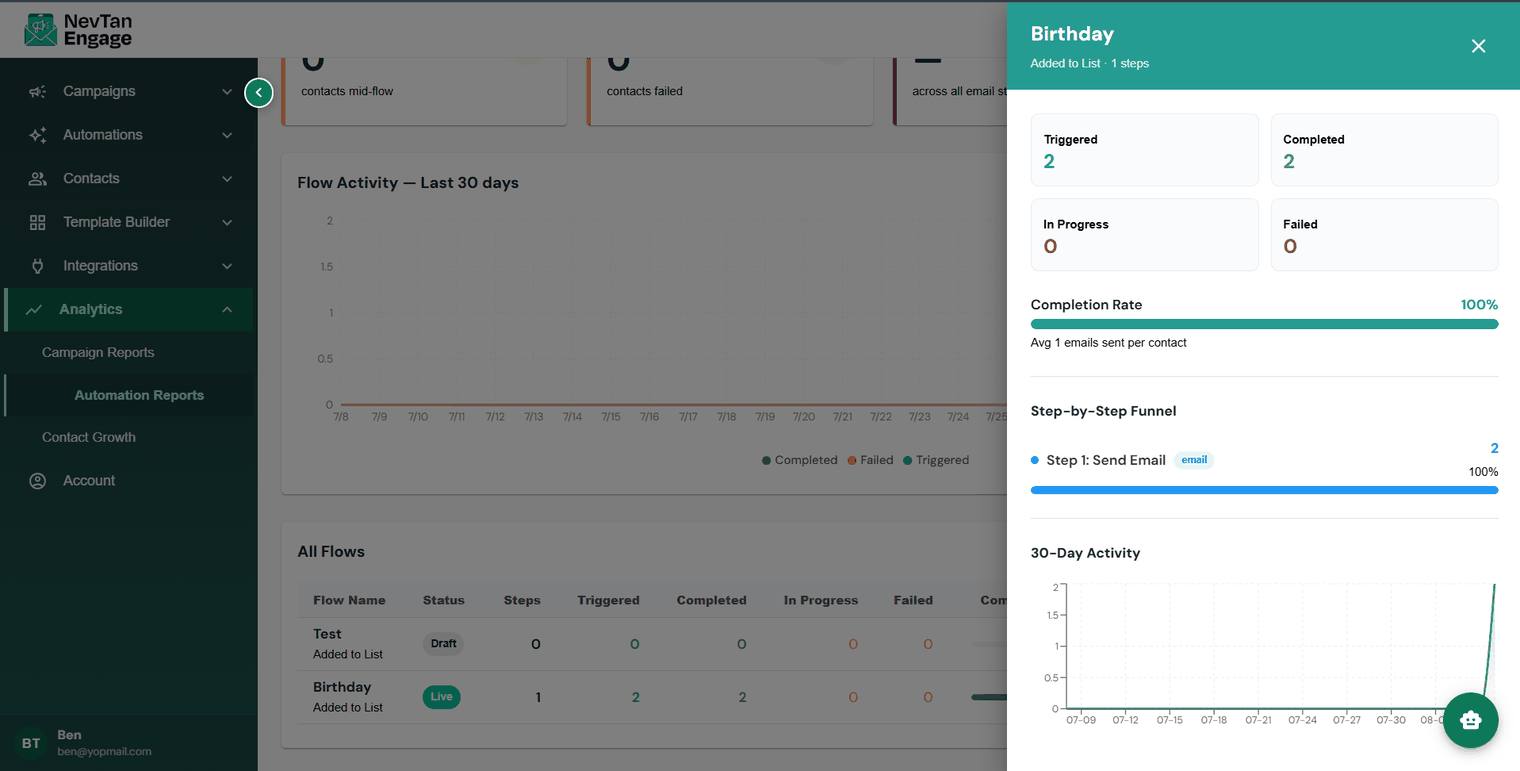
Exactly where people drop out
Look for the biggest single drop between two consecutive steps and fix that one thing. Optimising a step that only 5% of people reach is wasted effort.
Flow analytics requires a Starter plan or above.